Metrics and experimentation
Sample size for A/B tests
How many users you need, why tiny lifts demand huge traffic, and how to pick an MDE you would actually ship on.
You choose how often you tolerate a false ship (α, commonly 0.05) and how often you want to catch a real effect of a given size (power, commonly 80%). Sample size is the bill for those choices.
The effect size you plan for is the minimum detectable effect (MDE) — the smallest lift that would change the decision. It is a product judgment, not a stats output.
Concept
A Type I error is a false positive: you ship a useless change. Rate ≈ α if you do not peek or fish. A Type II error is a false negative: you miss a real win. Power = 1 − β.
Walking through the formula
For a two-sided test at α ≈ 0.05 and power ≈ 80%, a widely used approximation for users per arm on a binary conversion rate is:
n_per_arm ≈ 16 · p · (1 − p) / δ²p is baseline conversion. δ is the absolute lift you want to detect. Total users ≈ 2 · n_per_arm. The 16 comes from normal approximations and the usual z-values; it is a planning rule of thumb. Use a calculator for uneven splits or non-Bernoulli metrics.
Baseline p = 10% = 0.10. You want to detect an absolute +1 point lift (δ = 0.01), i.e. 10% → 11% (a +10% relative lift).
p · (1 − p) = 0.10 · 0.90 = 0.09
δ²          = 0.01²     = 0.0001
n_per_arm   ≈ 16 · 0.09 / 0.0001
            = 1.44 / 0.0001
            = 14,400
≈ 14.4k users per arm, ~28.8k exposed users total. Same answer from n_total ≈ 32 · 0.09 / 0.0001 = 28,800.
People say "detect a 10% lift" meaning relative. Absolute δ = 0.10 × 0.10 = 0.01 here. If baseline were 5% and you still wanted +10% relative, δ = 0.005:
n_per_arm ≈ 16 · 0.05 · 0.95 / (0.005)²
          = 16 · 0.0475 / 0.000025
          = 0.76 / 0.000025
          = 30,400
Halving δ quadruples required n, because δ sits in the denominator squared.
Traffic and calendar time
Site gets 4,000 eligible users/day, 50/50 split, 100% allocated:
days ≈ 28,800 / 4,000 = 7.2 daysRound up for weekly cycles → plan 2 weeks. If only 20% of traffic is eligible:
eligible/day = 0.2 · 4,000 = 800
days ≈ 28,800 / 800 = 36 days  → ~5–6 weeks
Even with enough users, run full weeks. Weekday vs weekend behavior differs. A practical rule: size for users and set a minimum duration (often 1–2 weeks), whichever is longer.
Choosing the MDE
Ask: what is the smallest lift that would change the decision? Baseline p = 8%, eligible traffic 1,500/day, p(1−p) = 0.0736:
δ = 0.005 (0.5 pp): n_per_arm ≈ 47,104   → ~63 days
δ = 0.010 (1.0 pp): n_per_arm ≈ 11,776   → ~16 days
δ = 0.020 (2.0 pp): n_per_arm ≈  2,944   → ~4 days (still run ≥1 week)
If stakeholders "need" a 0.5 pp call in two weeks, the experiment is underpowered by design. Negotiate MDE or timeline before launch. Do not run a theater test powered only for +3 pp that you would never require.
Tiny effects on noisy metrics need enormous traffic — or variance reduction (CUPED).
Common mistakes
- Confusing relative and absolute lift. "10% lift" at a 10% baseline is 1 pp, not 10 pp.
- Stopping on Friday because n arrived. Cover a full week.
- Powering for a lift you would not ship. Underpowered tests produce noisy "winners."
Check yourself
Baseline conversion is 20%. You want to detect a +10% relative lift. What is δ?
δ = 0.20 × 0.10 = 0.02 (absolute 2 percentage points).
You cut the MDE in half. What happens to required n?
It roughly quadruples, because n scales with 1/δ².
Key takeaways
n ≈ 16 · p(1−p) / δ²per arm at α = 0.05, 80% power for conversion tests.- The MDE is a product call: the smallest lift that would change the ship decision.
- Size for users and for calendar weeks. Underpowered tests are worse than waiting.
Further learning
Evan Miller's calculator is the standard interactive check against this approximation.
Evan Miller's A/B test sample size calculatorVisual, interactive sample size calculator ideal for planning online experiments and A/B tests.evanmiller.org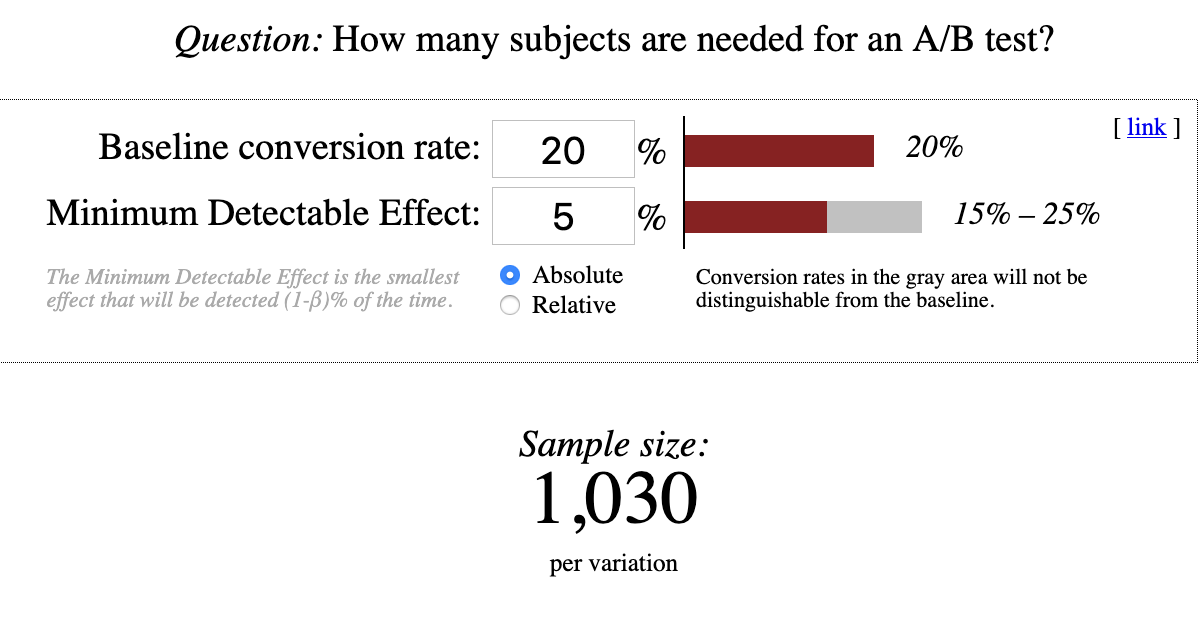
Next, read the result.
Related
A/B testing and experimentation
Designing randomized experiments, sizing samples with real arithmetic, reading lift and confidence intervals, and shipping only what the data actually supports.
Designing an experiment
Write the hypothesis, primary metric, guardrails, unit and exposure definition before anyone looks at a p-value.
Reading A/B test results
Lift, confidence intervals and p-values, and why a significant result can still be the wrong ship.