Metrics and experimentation
Experimentation pitfalls
Peeking, metric fishing, sample ratio mismatch, novelty effects, network interference, CUPED and Twyman's law — how trustworthy experiments go wrong and how to catch them.
An A/B test with broken methodology is worse than no test: it lends false confidence to a bad ship. Most of the damage is not exotic math — it is peeking at dashboards, testing twenty metrics until one is green, ignoring a skewed traffic split, or reading a two-day novelty spike as a permanent win.
This page assumes you already know how to design and size a clean experiment. Here is how that cleanliness dies in production, and the checklist that catches it.
Twyman's law: any figure that looks interesting or different is usually wrong. A +30% lift on revenue with no SRM check, no sensible CI width, and 800 users is almost certainly a bug — tracking break, wrong filter, currency mix, or bot flood. Assume instrumentation guilt first. Replicate before betting the roadmap. Kohavi's guidance: getting numbers is easy; getting numbers you can trust is the job.
Concepts in this section
Read them in order.
| Step | Concept | What it answers |
|---|---|---|
| 1 | Peeking at experiments | Why daily p-values inflate false ships |
| 2 | Metric fishing | Why 20 metrics almost always show a "win" |
| 3 | Sample ratio mismatch | When a 48/52 split means stop |
| 4 | Novelty and interference | Why day-one spikes and marketplaces lie |
| 5 | CUPED | How pre-experiment data buys sensitivity |
Pre-flight and readout
Before start: hypothesis, one primary, guardrails, unit, exposure event, sample size, end date or sequential plan, SRM alerting on, pre-declared segments.
During: watch only for severe regressions and SRM; do not optional-stop on the primary.
At readout: SRM clear? n reached? full weeks? novelty curve flat? primary CI? guardrails? segments coherent? Twyman pass (result plausible)? impact math uses the right population?
Revenue and count metrics are skewed: one enterprise customer can dominate an arm. Winsorize or use robust metrics (conversion, rather than raw dollars) for the primary when outliers are common. Post a short decision note even for kills. Organizations that only write up wins repeat the same failed ideas under new names.
Build a reputation for killing bad tests, not for shipping every green tile. Pair with product analytics so you can tell instrumentation bugs from true product effects.
Common mistakes
- Peeking and fishing. The two fastest ways to a false ship.
- Analyzing through SRM. Invalid until explained.
- Miraculous lifts. Twyman: assume a bug first.
- Triggered-population math applied to all MAU. State the denominator.
Key takeaways
- Peeking inflates false positives; use fixed horizons or proper sequential methods.
- One pre-registered primary. SRM means stop. Novelty needs week-scale runs.
- CUPED buys sensitivity, not validity. Twyman's law says miraculous lifts are bugs until proven otherwise.
Further learning
How Not To Run an A/B Test (Evan Miller)Are you falling victim to the peeking problem? Learn how to design and run an experiment properly.evanmiller.org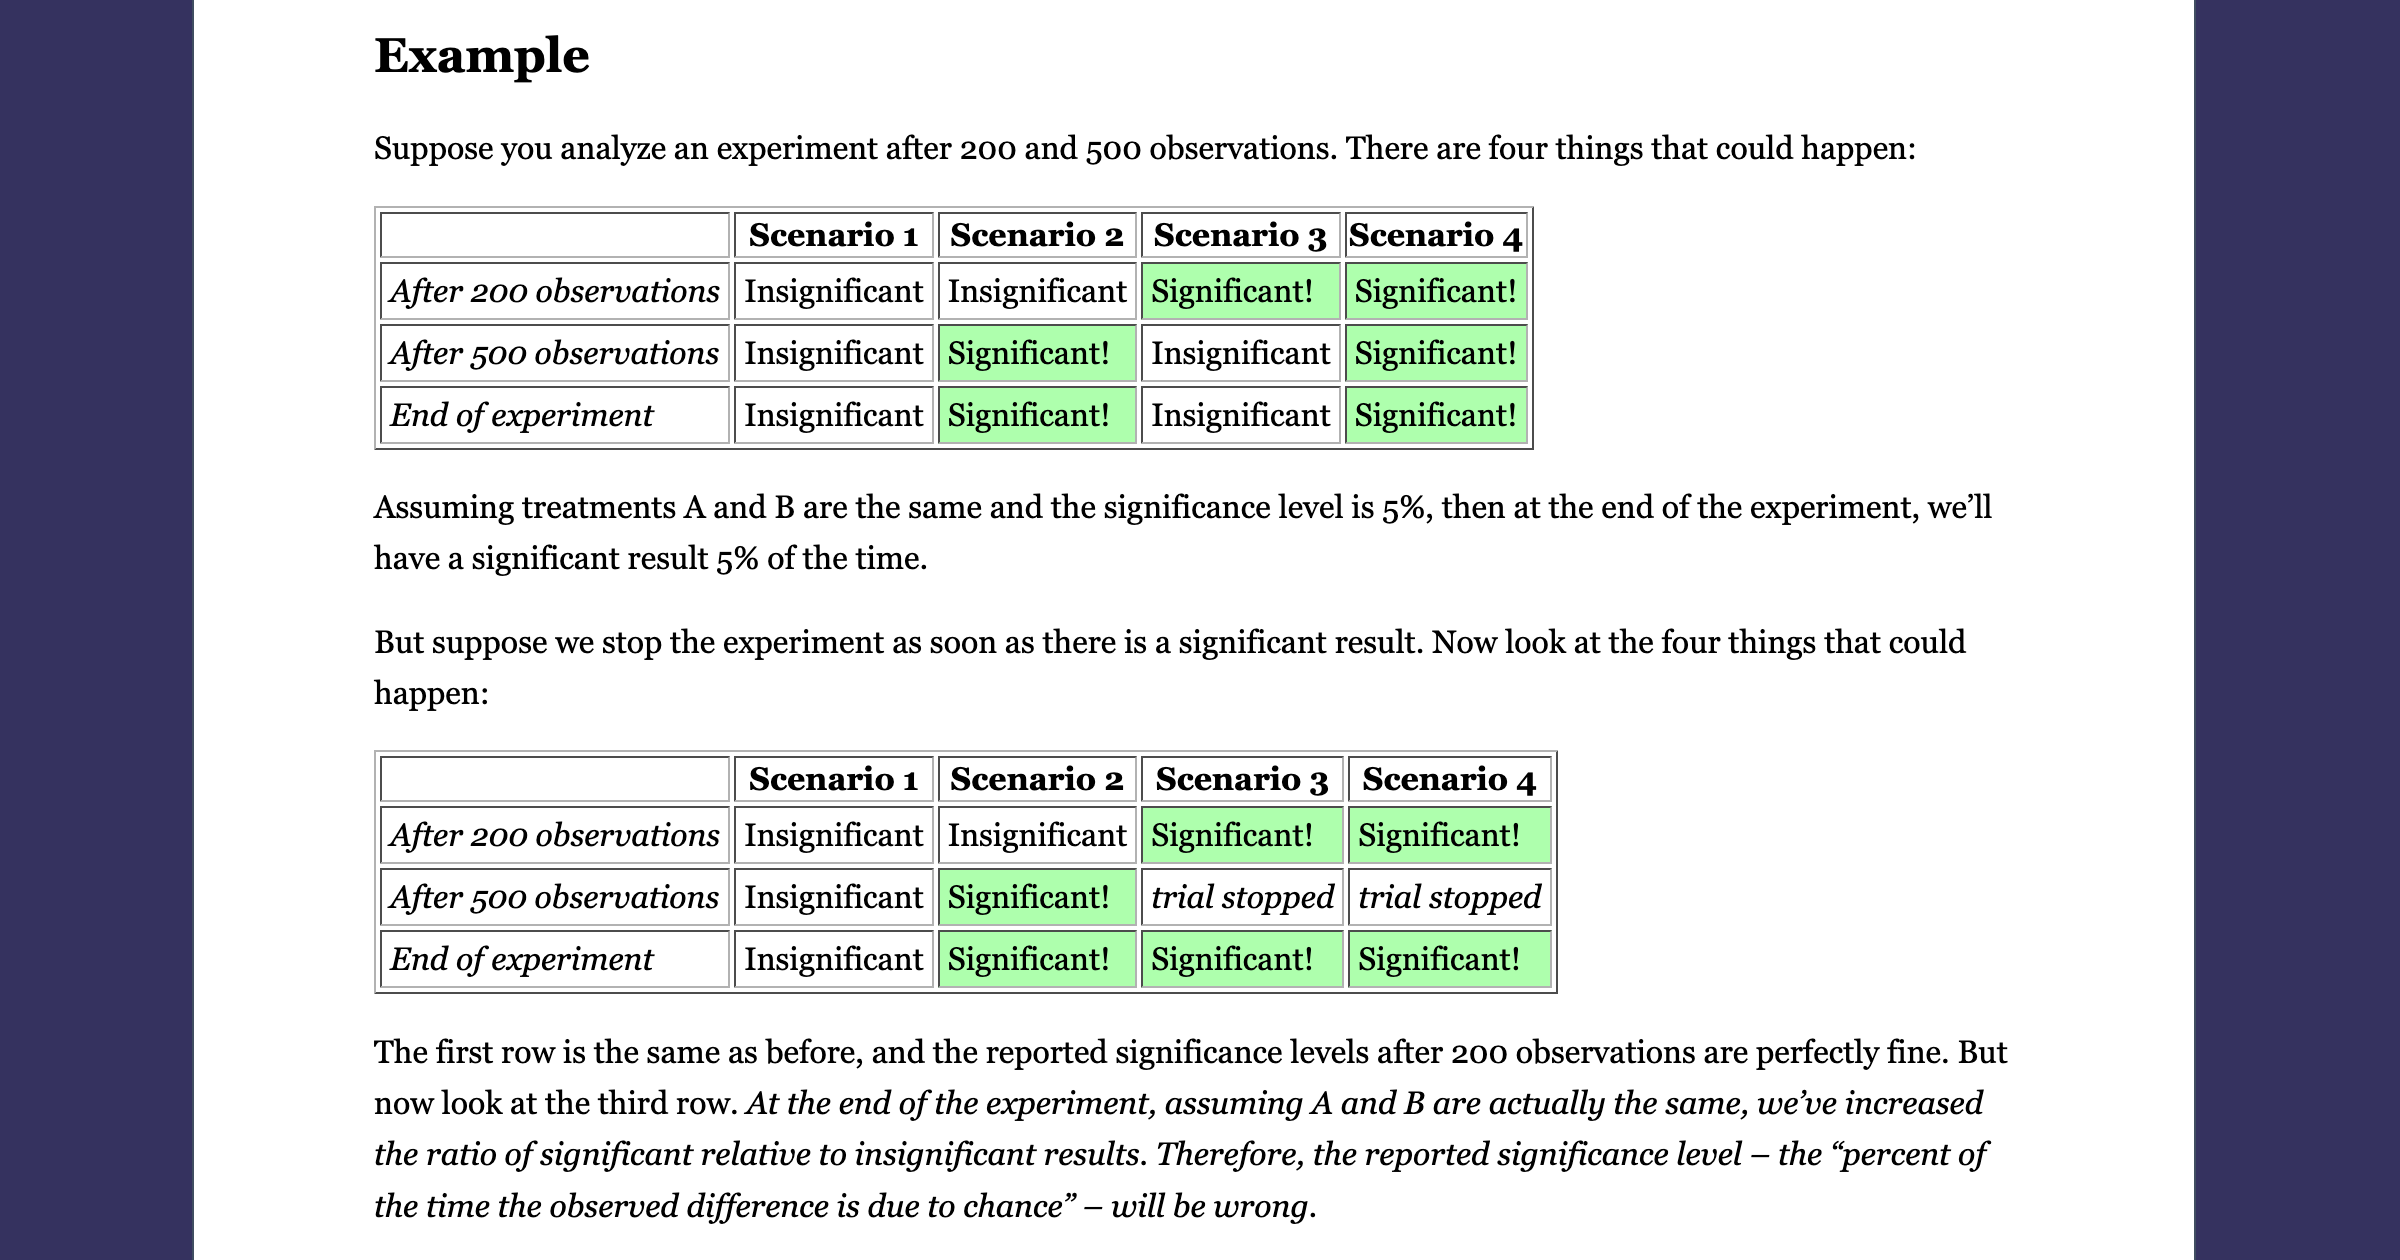 Trustworthy Online Controlled Experiments (Kohavi et al.)Experiment Guide – Accelerate innovation using trustworthy online controlled experimentsexperimentguide.com
Addressing the Challenges of Sample Ratio Mismatch in A/B Testing (DoorDash)careersatdoordash.com
Improving the Sensitivity of Online Controlled Experiments by Utilizing Pre-Experiment Data (Deng et al.)2013-02CUPEDImprovingSensitivityOfControlledExperiments.pdfai.stanford.edu
Trustworthy Online Controlled Experiments (Kohavi et al.)Experiment Guide – Accelerate innovation using trustworthy online controlled experimentsexperimentguide.com
Addressing the Challenges of Sample Ratio Mismatch in A/B Testing (DoorDash)careersatdoordash.com
Improving the Sensitivity of Online Controlled Experiments by Utilizing Pre-Experiment Data (Deng et al.)2013-02CUPEDImprovingSensitivityOfControlledExperiments.pdfai.stanford.eduRelated
A/B testing and experimentation
Designing randomized experiments, sizing samples with real arithmetic, reading lift and confidence intervals, and shipping only what the data actually supports.
LLM-as-a-judge
Using models to grade models: when a judge is the right grader, how to design one, and why an uncalibrated judge is a vibes function.
Product analytics
Designing event tracking plans, reading funnels and cohorts, writing the SQL that answers product questions, and avoiding mix-shift illusions. Start here for the map.