Metrics and experimentation
A/B testing and experimentation
Designing randomized experiments, sizing samples with real arithmetic, reading lift and confidence intervals, and shipping only what the data actually supports.
A dashboard tells you what happened. A randomized A/B test tells you what caused the change, because the only systematic difference between groups is the treatment you assigned. Most ideas fail — teams at large consumer companies routinely report that roughly two-thirds of experiments do not move the primary metric in the intended direction — so you test instead of shipping on a hunch.
The mechanism is simple. Hash users into control or treatment, log who actually saw the change, compare one pre-registered metric, and decide with a confidence interval — not a Friday p-value. Engineers implement assignment, exposure logs and the metric pipeline. Know enough stats to challenge "the dashboard is green."
Start simple: one primary metric, fixed horizon, no peeking, an SRM check, then ship or revert. Sophistication without discipline just produces confident mistakes.
Concepts in this section
Read them in order. Each one builds on the one before.
| Step | Concept | What it answers |
|---|---|---|
| 1 | Randomization and causality | Why a launch chart is not a cause |
| 2 | Designing an experiment | What to lock before anyone looks |
| 3 | Sample size for A/B tests | How many users, and what MDE to pick |
| 4 | Reading A/B test results | Lift, CI, and whether to ship |
For peeking, metric fishing, SRM, novelty and CUPED, see experimentation pitfalls. For the probability underneath, see probability and information.
A burst of judgment, not a formula
The MDE is a product call. If you would ship a checkout tweak for anything above +0.3 pp and your traffic cannot detect that in two months, either accept more uncertainty, use CUPED, or ship behind a flag with a longer holdout. Do not run a theater test powered only for a lift you would never require.
Running many tests on the same users can create interactions. Mature orgs use experiment layers with orthogonal bucketing, or a global holdout of a few percent of users who see the old world for months. Know which layer your flag sits in.
Modern stacks combine a flag service (rollouts, targeting, kill switches), assignment and exposure events in the warehouse, and one stats engine — frequentist fixed-horizon, sequential, or Bayesian. Pick one and train the org. Feature flags both serve the variant and stamp exposure.
In interviews, walk through hypothesis → metric → unit → sample size sketch → pitfalls. Interviewers care more about that structure than a memorized z-table. Bonus points for saying when you would not run a test.
Common mistakes
- Dual-writing a launch story. Shipping on Monday and reading Friday's chart as proof. Randomize, or stay honest that you do not know.
- Peeking. Stopping because an interim p-value looked exciting. See peeking.
- Theater tests. Powering for +3 pp when you would ship +0.3 pp, then calling a noisy week a win.
Key takeaways
- Randomization is how you get causality from product changes; dashboards alone do not.
- Pre-register hypothesis, primary metric, guardrails, unit and exposure.
- Size with
n ≈ 16·p(1−p)/δ²per arm for conversion tests at α = 0.05, 80% power. - Report lift, CI and guardrails; separate statistical significance from "worth shipping."
Further learning
The definitive industry book on online experiments.
Trustworthy Online Controlled Experiments (Kohavi, Tang, Xu)Experiment Guide – Accelerate innovation using trustworthy online controlled experimentsexperimentguide.comInteractive sample size calculator — verify the 14.4k example yourself.
Evan Miller's A/B test sample size calculatorVisual, interactive sample size calculator ideal for planning online experiments and A/B tests.evanmiller.org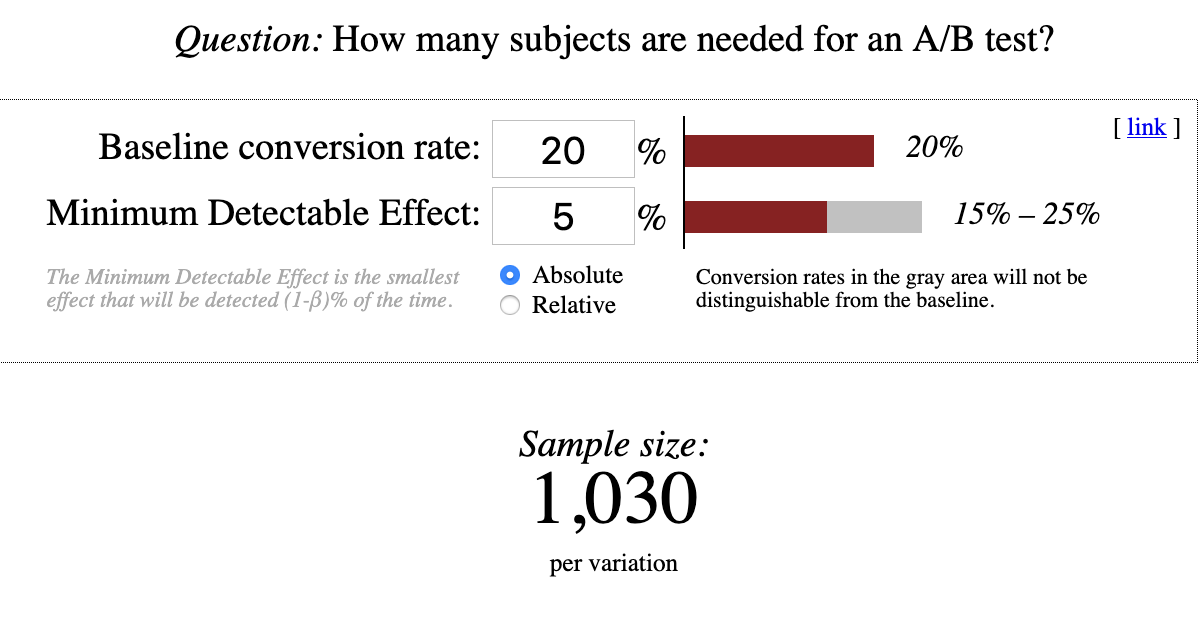
Ronny Kohavi on what actually works in large-scale experimentation programs.
Clear walkthrough of sample size math from a former Google data scientist.
Related
Experimentation pitfalls
Peeking, metric fishing, sample ratio mismatch, novelty effects, network interference, CUPED and Twyman's law — how trustworthy experiments go wrong and how to catch them.
Probability, statistics and information
The probability ideas behind ML losses, Bayes updates and honest uncertainty. Start here for the map of the section.
Configuration, environments and feature flags
Twelve-factor config, environment parity, secrets injection, feature flags and the blast radius of a bad config push.