Growth and monetization
The leaky bucket
Acquisition without retention only scales the leak. Improving churn compounds; buying more traffic does not change the hole in the bucket.
Acquisition without retention is a leaky bucket. You can spend forever pouring users in the top; if they leave, revenue, referrals and compounding growth loops never form. Retention is the percentage of a cohort that still uses the product after a given period — and it is usually the clearest signal of whether you have product-market fit.
For engineers, retention is not only a growth slide. It is the reason you care about reliability on the critical path, notification systems that do not spam and feature work that deepens a habit instead of decorating a dashboard.
Concept
A cohort is a group of users who started in the same period (signed up in the week of Jan 6, first paid in March). Retention analysis almost always compares cohorts over time rather than looking at a blended "active users" number that mixes new and old.
The big idea
Leaky-bucket math is unforgiving. Suppose you acquire 1,000 users per week and lose 20% of your active base each week (a terrible consumer retention profile). Steady-state actives ≈ inflows / churn rate = 1,000 / 0.20 = 5,000.
Double acquisition to 2,000/week and you get ~10,000 actives — linear scaling with spend. Cut weekly churn to 10% instead and the same 1,000/week inflows support ~10,000 actives. Improving retention compounds; buying more traffic does not change the hole in the bucket.
A real bucket with a hole is the picture. Pouring faster fills it only while you pour. Patching the hole means yesterday's water is still there tomorrow. The analogy breaks for products with a natural stop (tax software after April) — "churn" then is seasonality, not a miss.
Investors and experienced operators look at retention curves before CAC payback stories. If people do not come back, paid channels just accelerate cash burn. If they do come back, almost every other growth lever gets cheaper.
Walking through it
Same 1,000 weekly inflows:
churn 20%/week → steady actives ≈ 1,000 / 0.20 =  5,000
churn 10%/week → steady actives ≈ 1,000 / 0.10 = 10,000
Doubling spend at 20% churn also yields 10,000 — but you pay twice forever. Halving churn yields the same stock and keeps paying every week after. That is why retention work is often subtraction and reliability, not net-new surface area.
Match the retention window to how often a successful customer should show up: daily tools use D1 / D7 / D30 plus DAU/MAU; weekly tools use W1 / W4 / W12; monthly / episodic tools use M1 / M3 / M6. Using D30 for a monthly product makes healthy customers look churned.
Common mistakes
- Scaling paid while the curve decays to zero. You are buying a more expensive leak.
- Blended actives as "retention." Mix of new and old hides whether last month's cohort came back.
- Wrong frequency. Judging a monthly product on DAU, or a messenger on MAU-only.
Check yourself
- 1,000 weekly inflows, 20% weekly churn. What is steady-state actives, and what if churn is 10%?
5,000 at 20% churn; 10,000 at 10% churn — the same lift as doubling acquisition, without doubling spend.
- Why look at cohorts instead of "active users this week"?
Blended actives mix new and old. Cohorts tell you whether last week's starters still show up.
Key takeaways
- Retention compounds; acquisition without it only scales the leak.
- Steady-state actives ≈ inflows / churn. Patch the hole before you buy a bigger hose.
- Match the window to natural frequency, and always compare cohorts.
Further learning
What is good retention (Lenny's Newsletter)Although retention is widely considered to be the most important metric to get right when building (or investing in) a business, it’s also one of the least understood. Why? Because unless you’re a growth expert or an …lennysnewsletter.com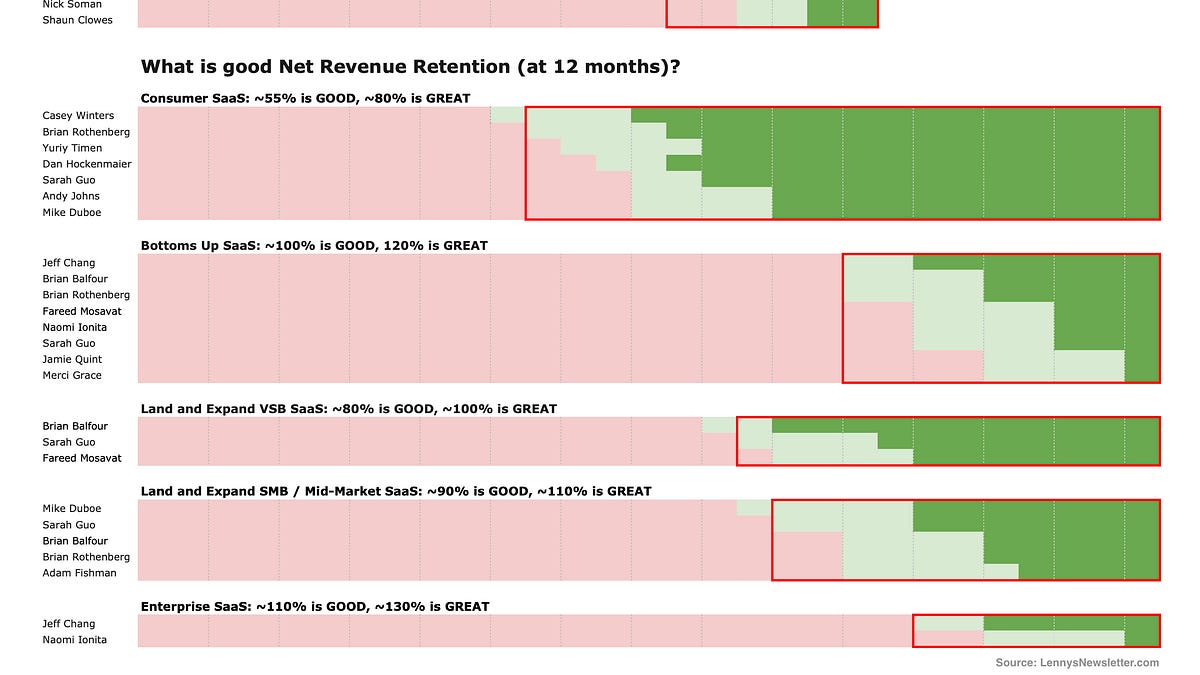
Next: how to read the shapes in retention curves.
Related
Retention and engagement
Retention curves, cohort analysis, DAU/MAU and why retention is the foundation of growth. Start here for the map.
Retention curves
Three shapes matter — decay to zero, flatten above zero, smile. Flattening is the product-market-fit signal. Compare cohorts, not blended actives.
Product-market fit
What fit feels like, how to measure it, the false positives that fool teams, and what changes after you find it.